Observability for Large Language Models (LLMs): A Practical Guide
- Shantanu Sharma

- Jan 10
- 13 min read

Table of Contents
1. What Is Observability in LLMs? A Detailed Overview
A simple mental model
Basic example
2. The Pillars of Observability
2.1 Logs: The Narrative
2.2 Metrics: The Health Indicators
2.3 Traces: The Story Across Services
2.4 New Pillars for LLMs: Evals & Feedback
3. Why Do We Need Observability for LLMs?
3.1 LLMs Fail Differently
3.2 Regulatory and Brand Risk
3.3 Cost and Performance
4. Why LLM Observability Matters at Scale
4.1 More Features, More Surprises
4.2 Continuous Model and Prompt Changes
4.3 Multi-Tenant, Multi-Region Complexity
4.4 The People Dimension
5. The Transformational Impact
5.1 From Gut Feel to Data-Driven LLM Strategy
5.2 Enabling Continuous Learning and Improvement
5.3 Increasing Trust (Internal and External)
6. Leading Tools in 2025
6.1 General Observability Platforms
6.2 LLM-Native Observability and Eval Platforms
6.3 Provider and Gateway Features
6.4 Homegrown and Open Source
7. My Takeaway
7.1 What I’d Do in the First 90 Days
7.2 Culture: How You Think About LLMs
Bibliography
From the outside, LLMs can look like magic. From the inside, at scale, they’re just another complex, failure‑prone distributed system — but with new kinds of failure modes.
Observability is how you keep that system honest, safe, and economically viable.
This is a practical, leadership‑oriented guide that starts from first principles and works up to the realities of operating LLMs in production. I’ll speak from the point of view of someone who has owned uptime, budgets, and stakeholder trust — not just dashboards.
1. What Is Observability in LLMs?
In traditional systems, observability answers a simple question:
Can I understand what’s going on inside my system just by looking at what it outputs (logs, metrics, traces)?
LLM observability keeps that foundation but adds new concerns: content quality, safety, retrieval performance, and cost.
For LLMs, observability needs to answer questions like:
What are users actually asking the model to do?
What did the model respond with, and how did it get there?
Was the response correct, on‑brand, safe, and useful for the user’s intent?
How much did it cost?
Which prompts, models, or features are breaking or quietly degrading?
Is retrieval (RAG) returning the right context, or is the model “hallucinating around” bad data?
A simple mental model
Think of an LLM system as a “black box” embedded in a business workflow:
Input: User query or API request
Processing: Prompt construction, retrieval (if any), model call(s), tool calls, post‑processing
Output: Model response, actions taken, user impact (e.g., ticket resolved, SQL run, email sent)
LLM observability is about capturing, inspecting, and analyzing all three layers consistently and safely — not just “Did the API return 200?” but:
Did it return something correct, safe, compliant, performant, and worth paying for?
Basic example
You’ve deployed an LLM‑powered customer support assistant.
Without observability:
You know the API is up.
You see request counts and average latency.
You don’t know if customers are getting wrong instructions, if the bot is hallucinating refunds, or if specific intents fail systematically.
With observability:
You see which intents are common and which ones users rephrase repeatedly.
You know which prompts or flows correlate with bad answers or escalations to human support.
You see where safety filters trigger and which policies are most frequently hit.
You track cost and latency by feature, model, and tenant.
You can tie all that back to CSAT, NPS, ticket deflection, and time‑to‑resolution.
2. The Pillars of LLM Observability
Traditional observability is often framed around three pillars: Logs, Metrics and Traces.
For LLM systems, you still need these three pillars, but each pillar gets LLM‑specific dimensions, and you add a couple of new pillars on top: Evals, Feedback, and Retrieval Analysis.
2.1 Logs: The Narrative
Traditional logs describe events. LLM logs must describe conversations, decisions, and retrieval.
For each LLM interaction, you want structured telemetry that (safely) captures:
Request metadata
Tenant / customer
User ID (or anonymized ID)
Feature / workflow name
App version, environment (prod / staging / region)
Prompt context
Raw user input
System / developer / tool instructions
Any retrieved documents or snippets (RAG context), or at least references/IDs
Prompt template name and version
Model call
Model name and version (e.g., gpt-4.1-mini, local-llama-3-8b)
Provider / gateway
Parameters (temperature, max tokens, top_p, etc.)
Response
Generated text (possibly redacted)
Any structured output (JSON, SQL, tool call arguments, function responses)
Parsed vs raw output (e.g., JSON schema validation status)
Outcome
Was the output accepted, edited, or overridden by the user?
Did it cause a downstream error (invalid SQL, failed API call, policy block)?
Safety flags (PII detected, toxicity, disallowed topics, prompt injection)
Business result where possible (ticket resolved? purchase completed? query run successfully?)
Tip: From day one, decide what can and cannot be logged. Treat PII and sensitive content as a first‑class design constraint.
Redact/tokenize before storage.
Configure data residency (e.g., EU vs US stores).
Assume legal/compliance will eventually ask to audit “who saw what, when, and why.”
Build these controls into the logging path, not as an afterthought.
2.2 Metrics: Health, Quality, Safety, and Cost
Metrics are your health indicators. For LLMs you still track latency, errors, and throughput, but you must add quality, safety, retrieval, and cost.
Performance & reliability
Latency (p50/p90/p99) per model, per endpoint, per key workflow
Error rates by type:
LLM provider errors, timeouts, rate limits
Validation failures (e.g., malformed JSON, SQL parse error)
Guardrail blocks
Throughput (requests per second / per minute)
Token usage:
Prompt tokens, completion tokens, total tokens
Tokens per feature / tenant
Cache stats (hit/miss) if you use response caching
Quality
Task‑specific metrics:
“Correct SQL” rate (via evals or human labels)
“Resolved intent” rate
Groundedness / hallucination rate (especially in RAG)
Human evaluation scores:
1–5 ratings, thumbs up/down, “was this helpful?”
Automated evals:
BLEU/ROUGE/other heuristics where appropriate
Model‑based grading (e.g., a stronger model judging correctness, style, safety)
Safety & compliance
Number and rate of blocked / redacted responses
Distribution of policy violation categories:
PII, hate, self‑harm, sexual content, competitor mentions, internal policy rules
Region and data residency breakdowns for safety incidents
Business & cost
Token cost: Cost per 1,000 tokens per model/provider
Non-token costs: Vector DB reads, embedding generation, reranking models, tool/API calls, GPU time (self-hosted), and egress.
Retry/amplification costs: Retries on rate limits/timeouts, agent loops, multi-call plans, “self-reflection” steps: these are often where costs blow up.
Cost per successful outcome:
Cost per resolved ticket, per completed workflow, per qualified lead
Impact on:
Time saved (average handle time, analysis time)
Conversion, revenue, or churn proxies where measurable
2.3 Traces: The Story Across Services
LLM apps are rarely “one call, one answer.” They’re chains or agents:
User sends a question.
You call a retriever or vector database.
You call one or more LLMs with retrieved context.
The LLM calls tools/APIs (databases, internal services).
You verify, transform, and return a response.
A trace captures this entire journey, end‑to‑end, as a tree of spans:
For LLM spans, traces should include:
Prompt and response (or hashed / redacted forms)
Model and provider
Latency, tokens used, approximate cost
Key eval scores (correctness, faithfulness, safety) where available
Retrieval details (e.g., which documents were used)
Traces are how you answer questions like:
“Why was this one request slow?”
“Why did this customer see that bad answer?”
“Where in this chain are we leaking money or reliability?”
2.4 Evals & Feedback: New First‑Class Pillars
Traditional observability doesn’t care much about “semantic correctness”; LLM systems have to.
Two additional pillars emerge in practice:
Evals (evaluation pipelines)
LLM evaluation is about scoring outputs that don’t have a single obvious correct answer.
You’ll often combine:
Structural checks: Does the output conform to the expected schema (valid JSON, valid SQL, required fields present)?
Reference‑based checks: Compare to a known “good” answer using heuristics (BLEU/ROUGE, exact match, etc.).
Model‑based grading: Use another model (often stronger or specialized) to score:
Correctness
Faithfulness to retrieved context (did the answer stay grounded?)
Safety / policy compliance
Style and tone (brand voice, reading level)
Human evals: Label a sample of interactions each week or sprint for your most critical flows.
Run evals on:
A held‑out evaluation set of realistic queries and answers.
Shadow traffic or sampled production traffic when you change prompts, models, or retrieval.
User feedback
User feedback is often your best signal of whether the system is working:
Explicit feedback
Thumbs up/down
“Was this helpful?” or “Did this answer your question?”
Short reasons when thumbs down (optional free‑text)
Implicit feedback
Edit distance between our suggestion and what the user ends up sending or executing
How often users:
Re‑ask the same question in different words
Escalate to a human
Abandon the flow after a response
Tie this feedback back into your traces and metrics so you can slice by:
Prompt version, model version
Tenant/segment
Feature / workflow
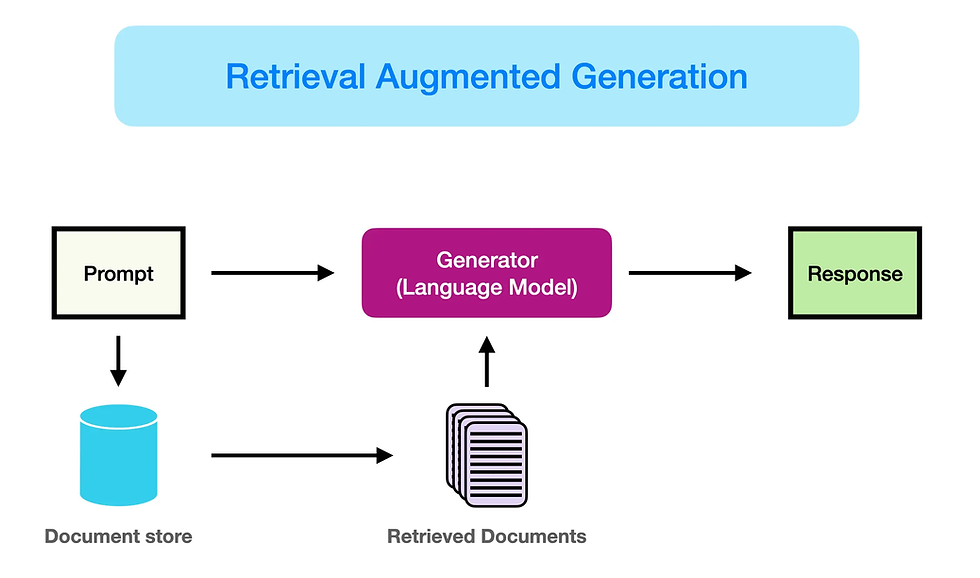
2.5 Retrieval Analysis (for RAG)
RAG pipelines add another critical component to observe: retrieval quality.
Even a great model can produce bad answers if the retriever brings back irrelevant or misleading context.
You need visibility into:
Query → retrieved documents relationship:
What did we retrieve?
Were the chunks relevant and sufficient?
Retrieval latency and cost:
Embedding model latency and token usage
Vector DB query performance
Eval metrics for retrieval:
Relevance scores (human or model‑based)
“Context coverage” — how often the right answer was present in retrieved docs
Hallucination rate conditional on retrieval success vs failure
This is how you distinguish:
“The model hallucinated despite good context” vs
“The model hallucinated because we gave it nothing useful.”
3. Why Do We Need Observability for LLMs?
You can ship an LLM feature without observability.
You just won’t know when it quietly starts hurting your users, your brand, or your budget.
3.1 LLMs Fail Differently
Traditional systems fail loudly: errors, crashes, timeouts.
LLMs often fail silently and plausibly:
Confidently wrong answers (hallucinations)
Subtle policy violations (leaking internal logic, partial PII)
Slightly off instructions that confuse users over time
Retrieval issues that degrade relevance long before you see obvious breakage
Without observability into content and outcomes, you’ll miss these.
Example:
You deploy an internal “SQL assistant” for analysts.
Uptime is 99.99%.
Error rate is near zero.
But:
15% of generated queries are subtly incorrect.
Analysts “fix it manually” and don’t complain loudly.
Decisions made based on wrong metrics quietly accumulate.
Only by logging queries and outputs — and measuring “correct SQL rate” via evals — do you discover the issue.
3.2 Regulatory and Brand Risk
LLMs can:
Echo or leak sensitive data.
Generate harmful, biased, or off‑brand content.
Violate industry rules (health, finance, legal, HR).
Your legal/compliance partners will eventually ask:
“Can we audit what the model said to whom and why?”
“Can we prove we defend against specific categories of harm?”
“Where is this data stored? Who has access to it?”
Without robust observability and data controls, your answer is effectively “not really,” which is not a long‑term position.
3.3 Cost and Performance
LLM costs grow quietly and non‑linearly:
A small increase in prompt length → a big token cost over millions of requests.
An extra chain step or unnecessary tool call → 2–3× latency.
A more expensive model used for low‑value tasks → margin erosion.
Observability lets you:
Attribute spend per feature, tenant, product line.
Identify “fat prompts,” redundant retrieval, and wasteful chains.
Make routing decisions:
When to use cheaper/faster models.
When to fall back to cached answers or deterministic logic.
4. Why LLM Observability Matters at Scale
Once you go beyond a prototype, observability isn’t “nice to have.” It’s how you stay in control.
4.1 More Features, More Surprises
At scale, you might have:
Dozens of prompts and flows,
Multiple models and providers (OpenAI, Anthropic, local models),
Per‑tenant overrides and custom instructions,
RAG pipelines with different knowledge bases.
Change one thing — a prompt, a model, a retrieval strategy — and something breaks in a corner you forgot existed.
With solid observability, you can:
Segment metrics and traces by feature, model, tenant, and region.
See which cohorts degrade after a change.
Run canary or shadow rollouts with confidence and automated evals.
4.2 Continuous Model and Prompt Changes
Models and APIs evolve quickly. Your team iterates on prompts weekly, sometimes daily.
This creates a moving target:
Prompt v3 + Model v1.5 behaves very differently from Prompt v2 + Model v1.2.
Provider updates can change behavior even if you don’t touch your code.
Evals and user satisfaction can regress, even when the provider claims “overall better.”
You need:
Versioning for prompts, models, retrieval pipelines, and guardrail policies.
Side‑by‑side A/B and offline comparisons.
Historical traces and logs to answer:
“What was the model doing last month when this incident happened?”
“What changed between the last ‘good’ and ‘bad’ versions?”
4.3 Multi‑Tenant, Multi‑Region Complexity
At enterprise scale:
Different customers have different data, policies, and risk tolerances.
Some regions require in‑region processing and storage (e.g., EU).
Some tenants want stricter filters or additional logging; others want minimal data retention.
Observability helps you:
Prove compliance per tenant and region.
Isolate incidents (“Only tenant X in region Y affected between times A and B.”)
Report SLAs (latency, quality, safety) per major customer.
4.4 The People Dimension
As LLM adoption grows, more stakeholders care:
Product: “Is this making users happier and more successful?”
Ops / SRE: “Is this stable and supportable?”
Finance: “Is spend in line with value? Where can we optimize?”
Legal / Compliance / Risk: “Is this safe, auditable, and defensible?”
Observability data becomes how you:
Justify or adjust budget.
Negotiate model/provider contracts.
Decide where to invest engineering effort:
Prompt & policy work?
Retrieval quality?
Fine‑tuning or model selection?
Infra and caching?
5. The Transformational Impact
Strong LLM observability doesn’t just prevent problems — it unlocks better products and faster iteration.
5.1 From Gut Feel to Data‑Driven LLM Strategy
Without observability:
Tuning prompts is art, anecdote, and cherry‑picked examples.
With observability:
You treat LLM behavior as an experimentable surface:
Change the prompt → see eval scores, user feedback, and business outcomes shift.
Change the model → see explicit trade‑offs in cost, latency, and quality.
Add or adjust retrieval → see hallucination and grounding metrics move.
5.2 Enabling Continuous Learning and Improvement
You want a loop that looks like this:
Production traffic → logged interactions → sampled & labeled (human or model‑based) → eval metrics → prompt/model/RAG tweaks → redeploy → measure again
With the right tooling, this becomes:
A weekly or bi‑weekly improvement cadence.
A safety net when adopting new providers or models.
A foundation for fine‑tuning and better RAG design over time.
5.3 Increasing Trust (Internal and External)
When stakeholders see:
Dashboards that track quality, safety, latency, and cost, not just uptime.
Clear playbooks for incidents and regressions (with traces to show root cause).
Transparent logs and audit trails when needed.
…they trust the system more and are more willing to:
Expand usage to more teams or workflows.
Move more critical processes onto LLM‑powered flows.
Approve the budgets required to run these systems responsibly.
6. Tooling Landscape
The LLM observability landscape is evolving quickly. Tools broadly fall into four categories:
General Observability Platforms
LLM‑Native Observability and Evaluation Platforms
LLM Provider and Gateway Features
Homegrown + Open Source Components
Treat this as a conceptual map, not a static vendor shortlist. Products change fast.
6.1 General Observability Platforms
Traditional observability tools (e.g., Datadog, New Relic, Grafana/Otel‑based stacks) are still essential for:
Infrastructure metrics (CPU, memory, GPU, network),
Service‑level metrics (HTTP status, error rates),
Distributed tracing across microservices.
Many now offer:
LLM‑aware integrations or plugins,
Custom spans and attributes for LLM calls (latency, token usage, model name, cost).
Leadership advice: Leverage what you already have for infra and service health, but don’t expect it to cover content‑level quality, safety, or retrieval out of the box.
6.2 LLM‑Native Observability and Evaluation Platforms
These tools specialize in:
Capturing prompts, responses, retrieval context, and tool calls,
Running automated evals on LLM outputs,
Providing LLM‑aware traces and debugging views,
Comparing prompts and models over time.
Common capabilities:
Prompt and chain tracing (integration with LangChain, LlamaIndex, etc.)
Quality and safety scoring dashboards,
Experiment management (A/B tests, offline evals),
Fine‑tuning and data curation support.
Look for:
Data controls: redaction, anonymization, retention, residency options.
Integrations: SDKs for your stack, hooks into your existing observability.
Multi‑model support: cloud APIs, on‑prem models, and gateways.
6.3 Provider and Gateway Features
If you’re using LLM APIs or routers/gateways, you’ll typically get:
Basic metrics:
Latency
Token counts
Error rates
Simple dashboards and sometimes basic safety analytics or eval samples.
Pros:
Very easy to start.
Zero or low integration overhead.
Cons:
Limited view into your application context and downstream impact.
Harder to unify across multiple providers.
Limited flexibility around custom evals, feedback, and business metrics.
6.4 Homegrown and Open Source
Most serious teams end up with a hybrid:
Use:
A general observability stack for infra and service health.
One LLM‑native tool for traces and evals.
Build:
Domain‑specific eval pipelines,
Custom dashboards that join:
LLM quality/safety metrics
Retrieval performance
Business metrics (conversion, time saved, revenue, risk events).
Typical open‑source components include:
Evaluation frameworks (e.g., DeepEval, RAGAS) to define tasks and scoring pipelines,
Prompt management and versioning tools,
RAG tracing and analytics libraries.
Practical adoption path:
Start with provider metrics + your existing observability stack.
As usage grows, add an LLM‑native observability/eval tool.
Layer in custom evals and business metrics as your main differentiator.
7. My Takeaway
If you remember nothing else, remember this:
You cannot safely and profitably run LLMs in production without treating observability as a first‑class product requirement.
7.1 What I’d Do in the First 90 Days
If I were parachuting into a team that was already live with LLM features, I’d:
7.1.1. Baseline the critical paths
Identify the 3–5 most important LLM‑powered workflows:
Revenue‑impacting
Customer‑facing
Compliance‑ or risk‑sensitive
7.1.2. Instrument the basics
Log, for each critical path:
Sanitized user input
Prompt, context, model name/version, key parameters
Retrieved documents (or references)
Output (raw + parsed)
Outcome: accepted, edited, escalated, blocked, errored
Track core metrics:
Latency, throughput, error rates
Token usage and cost
A simple quality proxy (thumbs up/down, task success flag)
7.1.3. Put guardrails and alerts in place
Safety filters for obviously harmful or non‑compliant content.
Alerts on:
Error spikes
Latency degradation
Sudden cost jumps
Drops in quality or satisfaction metrics
Surges in policy violations
7.1.4. Introduce evals and sampling
Build a small evaluation dataset from real user questions (anonymized).
Run automated evals whenever:
You change prompts significantly,
You change models or providers,
You alter retrieval strategy.
Sample a small percentage of production interactions each week for human review, focused on:
High‑risk use cases,
High‑value customers,
Newly changed prompts/models.
7.1.5. Create a simple LLM observability dashboard
Per major feature, expose at minimum:
Requests per minute,
p50/p90/p99 latency,
Error rate,
Token usage and cost,
A quality score (even if rough),
Safety / policy incidents,
Key retrieval metrics if using RAG.
Make this accessible to Product, Ops, and Leadership.
7.1.6. Establish ownership and process
Assign an LLM Reliability Owner (analogous to an SRE lead for AI features).
Define:
How regressions are detected and triaged,
How often prompts, models, and guardrails are reviewed,
How you document decisions (“why we changed this model/prompt/policy”).
7.2 Culture: How You Think About LLMs
The mindset shift I push with teams:
Stop thinking of the LLM as a “smart black box.”
Start thinking of it as:
A component that can and will fail in specific, diagnosable ways.
An experiment surface you can tune and measure.
A risk vector you can monitor, constrain, and mitigate.
When you adopt that mindset:
Observability is not a bolt‑on dashboard.
It’s a core part of the product and architecture from the first design review.
8. Bibliography
Langfuse Documentation: https://langfuse.com/docs
LangSmith Documentation: https://docs.langchain.com/langsmith/evaluation
Braintrust Documentation: https://www.braintrust.dev
Arize Phoenix Documentation: https://phoenix.arize.com
Helicone Documentation: https://www.helicone.ai
Datadog LLM Observability: https://www.datadoghq.com/product/llm-observability/
OpenLLMetry / Traceloop: https://github.com/traceloop/openllmetry
DeepEval Documentation: https://github.com/confident-ai/deepeval


Comments